Can election results be predicted by correcting biases in social polls from X?
Blog
- Student Profile: Mahmoud Said El-Sayed Abd-Allah
- Can election results be predicted by correcting biases in social polls from X?
- International Women’s Day: Celebrating Ad Astra Scholar Ava Canning
- Chinese New Year 2024 Celebration
- MSc Advanced Software Engineering Alumni
- Generative AI in Computing Education: Wrecking Ball or Holy Grail?
- My internship in digital strategy at Limerick City & County Council
- Clown Computing 101
- International Men's Day 2023
- Top marks for ChatGPT in the Leaving Certificate Computer Science Examination
- Alumnus Interview
- Student profile: Pasika Ranaweera, PhD student
- Staff profile: Associate Professor Neil Hurley, Head of School
- UCD CS PhD candidate award from IEEE Consumer Electronics Magazine
- UCD-Insight Collaboration Wins Prestigious Publication Award
- W@CS Alumni Roundtable
- Staff profile: Dr. Fatemeh Golpayegani
- Interning at a Smaller Tech Company
- Powering through the pandemic: My Remote Research Internship Experience
- Exploring Sense of Belonging in Computer Science Students
- Student Inter-Society Tech & Enterprise Meetup (SISTEM) held in UCD
- Computer Science Research and the COVID -19 Pandemic
- Zoom fatigue: how to make video calls less tiring
- SIGCSEire Launched at UCD CS
- Best Paper at the International Conference on Case-Based Reasoning (2019)
- ‘Spare tire genes’ explain why some genes can be lost by cancer cells
- Bi-annual CS Graduate Research Symposium
- UCD CS Postdoctoral fellow Claudia Mazo selected as a member of the ACM Future of Computing Academy
- Security, Privacy and Digital Forensics in the Cloud
- Chidubem Iddianozie: PhD student and GitHub Ambassador in UCD
- UCD CS PhD student selected to attend the Heidelberg Laureate Forum
- New Project: Evidence-Based Decision Support for Real-Estate Investment
- UCD projects celebrate Europe Day
- Research Award at the 2019 ACM SIGCSE Technical Symposium on Computer Science Education
- Top Tips for Student Scholarships
- I am a Computer Scientist and a Cancer Biologist
- Critical thinking and data ethics in UCD CS
- Teaching at BDIC Beijing
- Reading 35,000 Books
- Secret to a Great Internship
- 12 Tips for PhD Researchers
- Buddy Coders - a new initiative to support women in Computer Science

Can election results be predicted by correcting biases in social polls from X?
Assistant Professor Przemek Grabowicz writes that thousands of polls on X suggest Trump is leading the election race by a landslide. However, while many recognize the bias in these polls, there is an unexpected—and fascinating—twist...
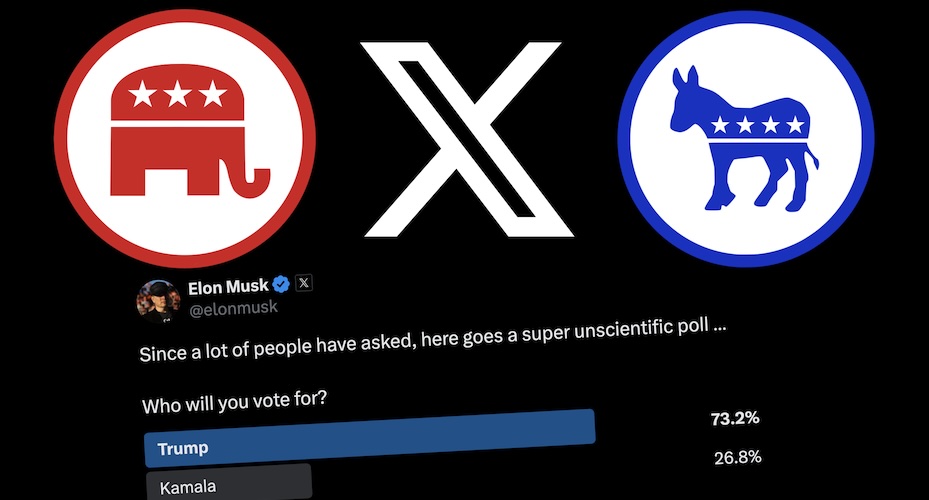
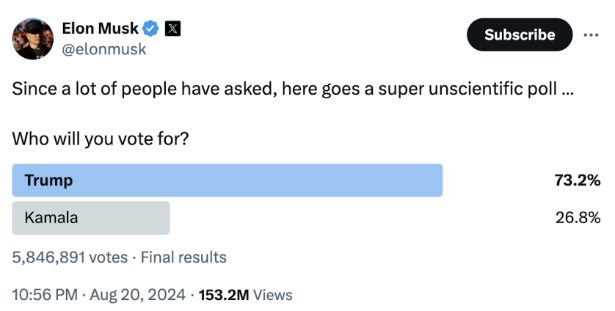
Informal political polls have grown in popularity on X, the platform formerly known as Twitter. For instance, one such (opens in a new window)poll, conducted recently by billionaire X owner Elon Musk, received over 5 million votes. It showed the Republican nominee, Donald Trump, leading over the Democratic nominee Kamala Harris by a landslide, 73.2% to 26.8%. Trump publicly featured the results of (opens in a new window)multiple (opens in a new window)such (opens in a new window)polls on his social media platform, Truth Social, presumably to create the impression of his overwhelming popularity.

My recent TechPolicyPress (opens in a new window)article summarizes our research on biases and manipulation in such polls. However, the story of social polls on X has an unexpected twist…
As we studied the biases in election polls published on X, it became clear that their bias was driven by the Republican lean and demographics of poll participants. However, these biases can be corrected to make estimates of public support for the candidates. The correction process, in essence, makes social poll outcomes representative of US voters using the so-called (opens in a new window)regression and post-stratification methodology…
You’re probably thinking now: you must be kidding!…
Bear with me…
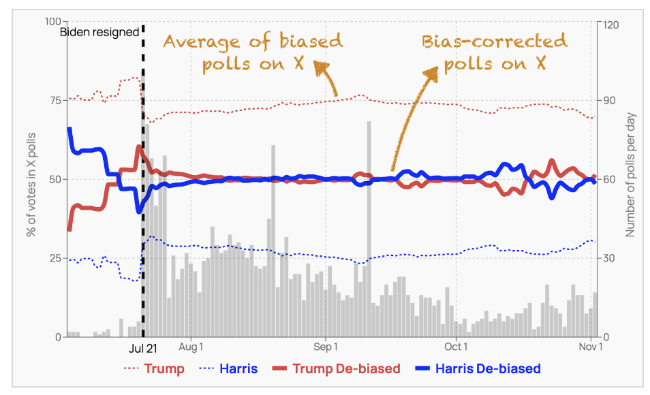
Our research team computed a running average of support for the 2024 US presidential candidates, Harris and Trump – attached below (opens in a new window)timeline figure from our website tracking X polls. Polls on X resulted in an average of 70% to 75% votes for Trump (dashed red line). However, once we corrected for the biases among X poll participants to estimate support more representative of the US voting population, we got a running average that oscillates around 50% support for each of the candidates (solid red and blue lines). By correcting biases in X polls, we obtained a drastically different picture of the election: a nose-to-nose horse race.

One might say, great but is there something to learn from this time series, or (opens in a new window)is the situation equivalent to the randomness of a coin flip?
First, it turns out that our bias-corrected estimates of support for US presidential candidates based on X polls were more accurate than traditional polls!(opens in a new window)1 We estimated 52% for Trump vs 48% for Harris based on polls published before the election day. As of November 7, there were 72,641,564 votes for Trump (51.7%) and 67,957,895 for Harris (48.3%).
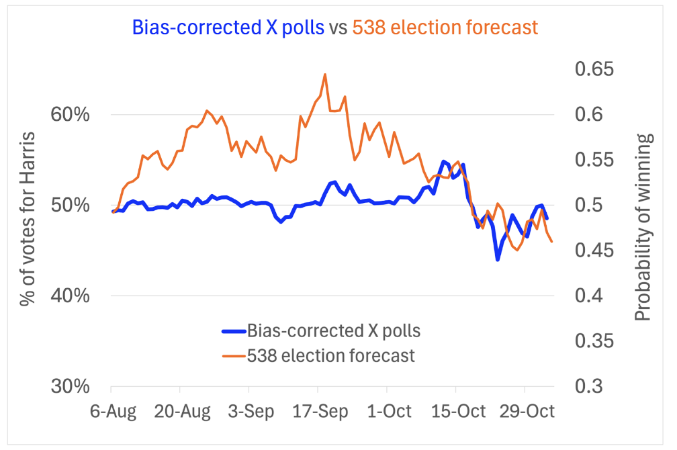
Second, let’s compare this bias-corrected estimate of popular support, grounded in biased X polls, with the well-known forecasting model of 538 (ABC News sponsored) that uses traditional election polls.(opens in a new window)2 The two time series created starkly different pictures of the presidential election horse race in August and September. 538 was forecasting that Harris is, in relative terms, 50% more likely to win the election than Trump. However, in October the two time series started to overlap while oscillating around 50% support for each candidate. Can this be a coincidence?

On the 5th of October, Musk joined Trump’s presidential election campaign event in Pennsylvania, a key swing state, forecasted by 538 as the most pivotal state in the election. Musk literally, and famously, jumped onto the stage at that event and into Trump’s presidential election campaign. On October 20, Musk launched a daily lottery, giving away $1 million to a registered swing state voter. These unusual events may be reflected in the two time series lines showing dipping support for Harris after October 15 and between October 20-25.
The time series of public support estimates based on X polls does not only synchronize with the 538 forecast. It also synchronizes with prediction markets, where players bet on the winner of the election, such as PredictIt and Polymarket (blue lines below).(opens in a new window)3These are not the only events in which there is synchrony between the four time series lines. In fact, right after the September 10 debate between Harris and Trump, the support for Harris increased according to all four time series (see the below, and above, figure).

It is unlikely that all these relationships are accidental, but more research is needed to establish the forecasting potential of bias-corrected estimates on biased polls from X. For instance, I’m curious how such estimates hold in comparison to top forecasting models in the (opens in a new window)profitability test proposed by Rajiv Sethi (check out his (opens in a new window)post). This research is fascinating, particularly given how drastic a twist the idea of accurately estimating public opinion from X polls is in comparison to the realization that extremely biased X polls, quite frankly, misinform users.
If X was committed to poll accuracy, they could compute and publish on their platform such bias-corrected estimates of public support. Not only that, but X could do it with a much higher precision than us, because the platform has access to much more data. Our bias-corrected estimation method applies various AI components, including a large language model, a demographic classifier, and a partisanship classifier. It is a data-intensive and computationally complex approach. Our approach resembles the vision of the famous sci-fi writer, Isaac Asimov (admired by Musk), outlined in his short story (opens in a new window)Franchise. Asimov envisioned a supercomputer, called Multivac, that would forecast election outcomes by identifying and interviewing an extremely small sample of representative voters.
To do justice to this vision, X may need to commit to a point of distinction between freedom of speech and freedom to misinform.
Disclaimer: I recently accepted a faculty position at University College Dublin and transitioned to the role of adjunct professor at the University of Massachusetts Amherst. My move is, in part, motivated by the introduction of the Digital Services Act (DSA) in the European Union, a regulation that facilitates the study of social media platforms and their impact on democratic societies. Without such regulation, it would be practically impossible to continue studying polls on X, because X has limited academic access to data since Musk bought the platform.

(opens in a new window)1 This paragraph was added to this blog post after the election day, wheres all other parts of the post were published on the election day.
(opens in a new window)2 We’re comparing here slightly different things: the percentage of population supporting a candidate (estimated based on data from X) with the probability of the candidate winning the election (estimated by 538 based on traditional polls).
(opens in a new window)3 Price of a prediction market contract bidding that a particular candidate will win the election is yet another thing than both the percentage of population supporting a candidate and the probability of that candidate winning the election. Nevertheless, the three are related, as this post shows.
6 November 2024