Study pinpoints ‘hotspots’ of harmful air pollutant in Dublin City
Posted 11 December, 2024

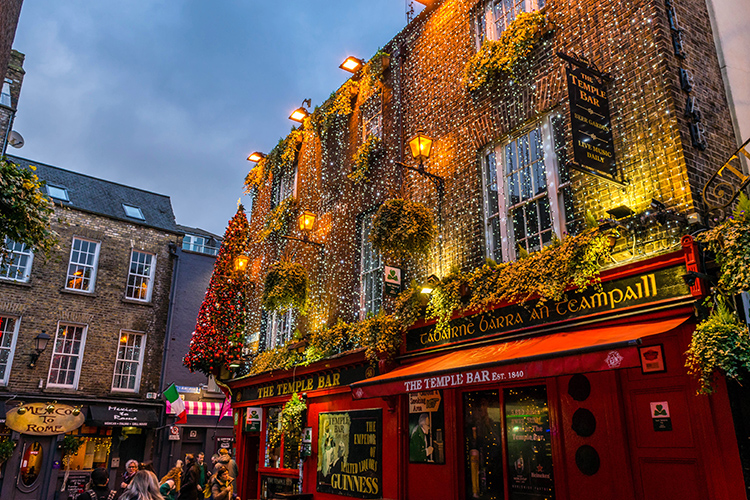
Areas of particularly high concentrations included Cork Street, O’Connell Street, and around Temple Bar Credit: Olliebailie / Wikimedia Commons
Levels of nitrogen dioxide (NO2) exceeding World Health Organisation (WHO) guidelines have been found in hotspots across Dublin city, (opens in a new window)according to a new study.
Data collected by University College Dublin and Dublin City University (DCU) researchers shows high levels of NO2 and fine particulate matter (PM2.5) across Dublin’s inner city.
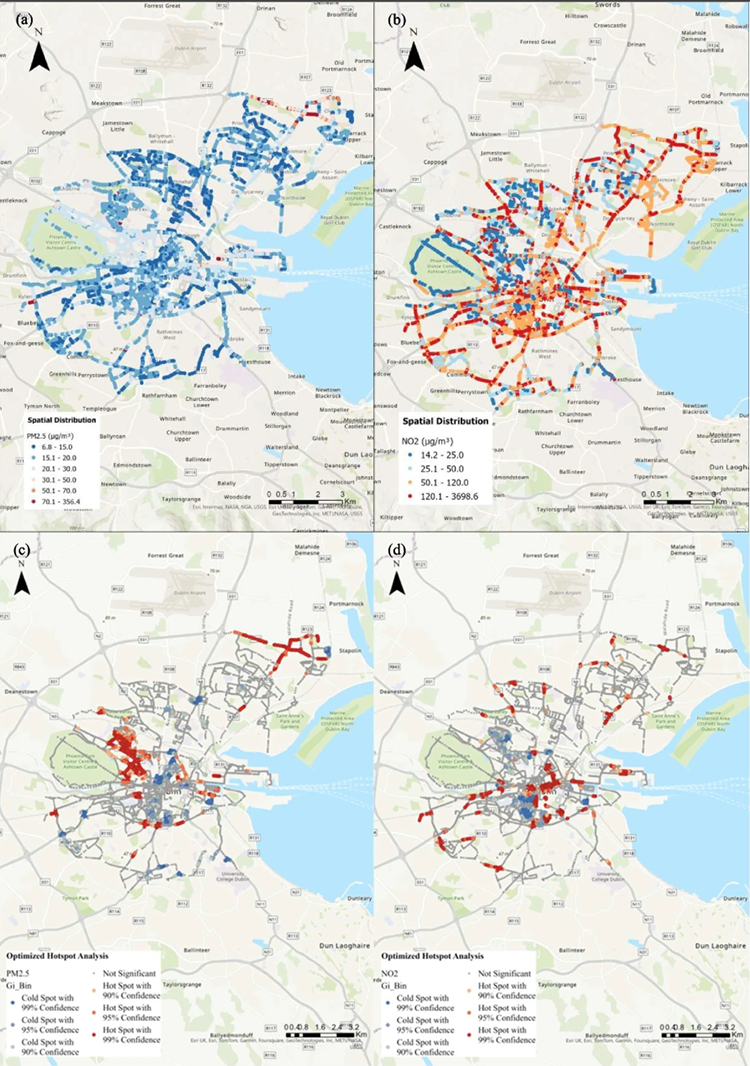
Areas of particularly high concentrations included Cork Street, O’Connell Street, along the Quays, and in the area around Temple Bar.
The data showed that during the sampling period, 49.4% of days exceeded WHO guidelines for NO₂ levels, with peaks during rush hours, especially in winter.

Spatial distribution of highly polluted a PM2.5 and b NO2 along with optimized hotspots analysis results for PM2.5 and d NO2 in Dublin City
Collected as part of the (opens in a new window)Google Air View project over a period of 16 months, using electric Google Street View cars equipped with air sensors, the data showed that during the sampling period, almost 50% of days exceeded WHO guidelines for NO₂ levels, with peaks during rush hours, especially in winter.
Carried out by (opens in a new window)Dr Jiayao Chen, (opens in a new window)Dr Anna Mölter, Dr José Pablo Gómez-Barrón and (opens in a new window)Professor Francesco Pilla, UCD’s School of Architecture, Planning and Environmental Policy, and Dr David O’Connor from DCU’s School of Chemical Sciences, the study suggests the potential of a mobile monitoring approach to investigating hyperlocal air pollutants across cities.
“Traffic pollution is a critical issue in urban cities, often contributing to or exacerbating environmental or social-economic inequalities,” said Dr Chen.
“Our finding represents a unique case for Dublin, on highly polluted days domestic heating emerged as the dominant contributor to PM2.5 at street level. Our research emphasises the need for detailed temporal guidance, especially for vulnerable populations, to help guide safe indoor and outdoor activities.
“With the EU recently introducing stricter air quality guidelines, our findings underscore the need for long-term, localised monitoring to inform strategic mitigation plans tailored to both local and regional scales.”
The ‘Top 10’ highly air polluted areas in Dublin:
- Cork Street, extending from Brabazon Row to Newmarket.
- Saint John’s Road West, from Custom House Quay, running along North Wall Quay to Cardiff Lane.
- O’Connell Street Upper, from Promenade Rode, crossing Bond Drive to Tolka Quay Road and Alexandra Road (Dublin Port).
- The road along the River Liffey extending to Temple Bar, crossing O’Connell Bridge and continuing to the North Wall.
- N81, along the Wood Quay and extends to Harold’s Cross Road and James’s Street.
- Crossroad around Newtown Court way-Clarehall Avenue and Malahide Road-Churchwell Drive.
- The vicinity area encompassing Sir John Rogerson’s Quay and Hanover Quay.
- From Custom House Quay, extends along North Wall Quay to Alexandra Road.
- Cork Street, following Brabazon Row to Newmarket.
- Residential area located at the southeast side of Riverston Abbey; intersection of R101 and N3 (Dalymount) extending along R101 to Chesterfield and North Road of Phoenix Park.
Dr O’Connor added: “As more cities adopt hyperlocal sensing, the potential to create healthier urban environments grows. Localised air quality data provides the foundation for tailored, evidence-based policy solutions that can tackle pollution at its source, particularly in high-risk and vulnerable areas.”
By: David Kearns, Digital Journalist / Media Officer, UCD University Relations
To contact the UCD News & Content Team, email: newsdesk@ucd.ie


